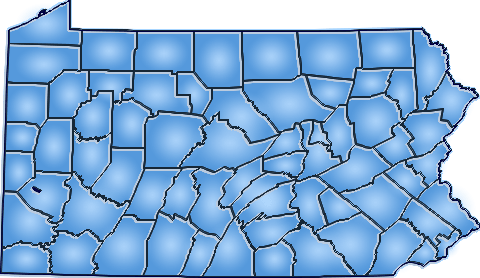
  Introduction & SummaryPair and compare two distinct earnings industry sectors of your choosing to examine their relative importance and performance across all of Pennsylvania's 67 county economies over 1969-2022. Contrast and assess, for example, the comparative importance of earnings for the Educational Services sector across the counties of Pennsylvania against Wholesale Trade, or any other two sectors you elect to select. Apply the interactive tools included in this module to conduct your own research about how any two industry sectors compare and contrast across the counties of Pennsylvania. The analytical tools at your disposal for ranking and sorting the importance and growth of individual industry sectors across counties include: percent of total industry earnings locally, location quotients, percent of State total sector earnings, growth rates and growth rates differenced against overall averages locally and their counterparts nationwide. Directions
Additional Notes on EarningsThe earnings by major industry estimates compiled by the Bureau of Economic Analysis (BEA) are by place of work, and are the sum of wage and salary disbursements (payrolls), supplement to wages and salaries, and proprietors' income. Additional Suggested AnalysisTo view and examine the short vs. long term growth of all 67 Pennsylvania counties click on the graph below.  | Analysis Options Menu |


